Tianqiong Sensor IOT Technology Co., Ltd
Sales Manager:Ms. Emily Wang
Cel,Whatsapp,Wechat:+86 15898932201
Email:info@fengtutec.com
Add:No. 155 Optoelectronic Industry Accelerator, Gaoxin District, Weifang, Shandong, China


Sales Manager:Ms. Emily Wang
Cel,Whatsapp,Wechat:+86 15898932201
Email:info@fengtutec.com
Add:No. 155 Optoelectronic Industry Accelerator, Gaoxin District, Weifang, Shandong, China
Model:FT-NQ10
Brand:tianqiong
1.Introduction to Farmland Weather Station
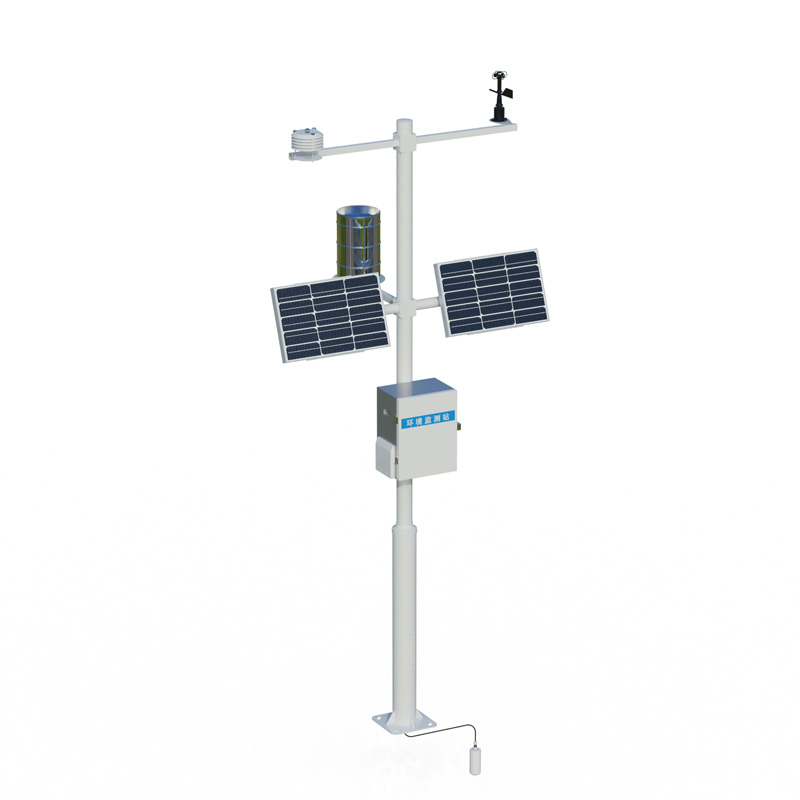
Farmland Weather Station is used for weather monitoring in farmland, 24 hours monitoring and recording temperature and humidity, soil temperature, soil moisture, light intensity, carbon dioxide, etc.NQ10 Farmland Weather Station is a highly integrated, low-power, fast installation and easy for field monitoring.
The device consists of five parts: meteorological sensor, collector, solar power supply system, pole support, and cloud platform.It is free of debugging and can be quickly arranged, and is widely used in meteorological, agriculture, forestry, scientific investigation and other fields.
2.Features of Farmland Weather Station
1.Low-power collector: static power consumption is less than 50uA
2.Standard GPRS networking, support extended Bluetooth, and wired transmission
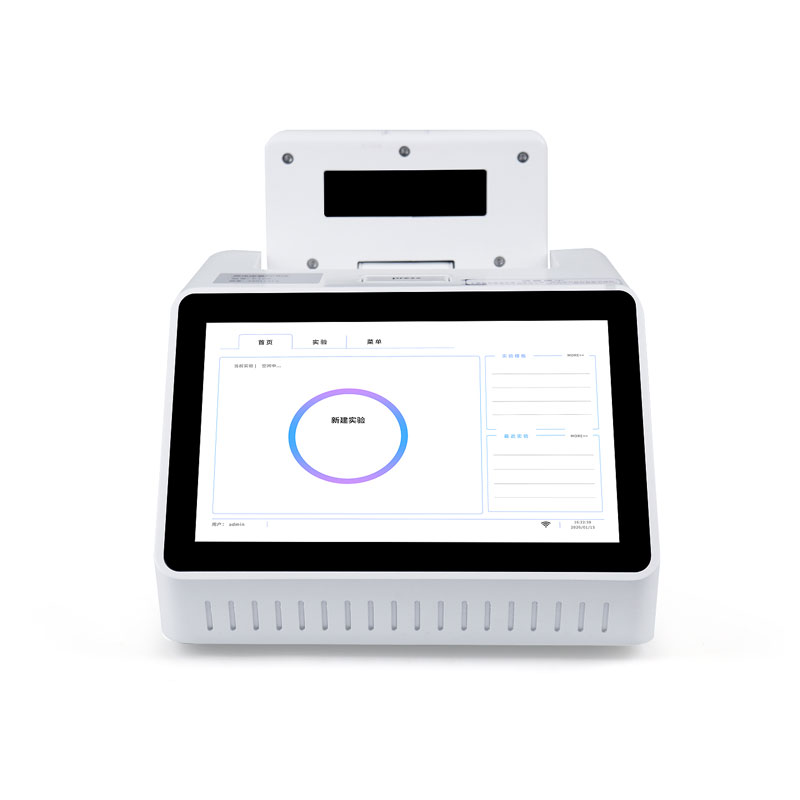
3.Seven-inch Android touch screen, version: 4.4.2, quad-core Cortex™-A7, 512M/4G
4.Support modbus485 sensor expansion
5.Solar charging management MPPT automatic power point tracking
6.Three-meter carbon steel bracket, two threaded screw connection
7.Send SMS alarm, send SMS to the specified mobile phone after exceeding the limit
8.Stainless steel protective box, corrosion-resistant and oxidation-resistant, waterproof grade IP66
3.Technical parameters of Farmland Weather Station
1.Collector power supply interface: GX-12-3P plug, input voltage 5V, with RS232 output Json data format, collector power supply: DC5V±0.5V peak current 1A,
2.Sensor modbus, 485 interface: GX-12-4P plug, output power supply voltage 12V/1A, device configuration interface: GX-12-4P plug, input voltage 5V
3.Solar power supply and equipped with lead-acid batteries, optional 30W 20AH/50W 20AH/100W 100AH.Charging controller: 150W, MPPT automatic power point tracking, efficiency is increased by 20%.
4.Data upload interval: 1 minute-1000 minutes adjustable
5.Screen size: 1024*600 RGB LCD
6.Some sensor parameters
| name | Measurement range | Resolution | Accuracy |
| Ambient temperature | -40~+80℃ | 0.01℃ | ±0.3℃ (25℃) |
| Relative humidity | 0~100%RH | 0.01%RH | ±3%RH (20%~80%) |
| Light intensity | 0-157286LUX | 1Lux | <±3% |
| Atmospheric pressure | 300-1100hpa | 0.1hPa | ±0.25% |
| Dew point temperature | 0~+70℃ | 0.1℃ | ±1℃ |
| Tube soil temperature | -30~+70℃ | 0.01℃ | ±0.3 (-10~70℃) |
| Tube soil moisture | 0~100% | 0.1% | ±3% |
| Tube Soil Salt | 0~20000us/cm | 1us/cm | ±3 (0~10000us/cm) ±5% (full range) |
| Soil PH (electrode method) | 0-14PH | 0.01 | ±0.1PH |
| Soil nitrogen, phosphorus and potassium | 0~1999mg/kg | 1mg/kg | ±2% |
| Soil evaporation | 0~75mm | 0.1mm | ±1% |
| wind direction | 0~360° (8 directions) | 1/8 | <3°(>1.0m/s) |
| Wind speed | 0~30m/s | 0.1m/s | ±(0.2+0.03V) m/s (25℃, V indicates wind speed) |
| rainfall | ≦4mm/min | 0.2mm | ≤±2% |
| Ultraviolet radiation | 0~500W/㎡ | 0.01W/㎡ | ≤±3% |
| Sunshine hours | 0~6500h | 0.1h | <0.2h |
| Total photoelectric radiation | 0-2000W/m2 | 1W/m2 | <±3% |
| Photosynthetic effective radiation | 0-2000W/m2 | 1W/m2 | ≤±5% |
| carbon dioxide | 400-5000ppM | 1ppM | ±(50ppm+5% reading |
| PM2.5 | 0-1000ug/m³ | 1ug/m³ | ±10% (<500 micrograms) |
| PM10 | 0-1000ug/m³ | 1ug/m³ | ±10% (<500 micrograms) |
| Carbon monoxide | 0-1000ppm | 1PPM | ±2PPM |
| Sulfur dioxide | 0-20PPM | 0.1PPM | ±1PPM |
| Nitrogen dioxide | 0-20PPM | 0.1PPM | ±1PPM |
| ozone | 0-20PPM | 0.1PPM | ±1PPM |
| Negative oxygen ions | 0~100,000 units/cm3 | 1/cm3 | Reading ±10%; ion mobility ≤±20% |
| Oxygen content | 0~25%Vol | 0.1% | ±3%FS |
4.Farmland Weather Station Cloud Platform
1.CS architecture software platform, supports direct observation of mobile phones and PC browsers without additional software installation.
2.Support multiple accounts and multiple devices to log in
3.Support real-time data display and historical data display dashboard
4.Cloud server and cloud data storage are stable and reliable, easy to expand, and load balancing.
5.Support SMS alarm and threshold settings
6.Support map display and viewing device information.
7.Support data curve analysis
8.Support data export table form
9.Supports data forwarding, HJ-212 protocol, TCP forwarding, http protocol, etc.
10.Support data post-processing function
11.Support external running of javascript scripts
Pine wood nematode rapid detection device is a professional device utilizing molecular biology techniques. It integrates the processes of pine wood nematode isolation, DNA extraction, and quantitative fluorescence PCR detection to achieve rapid and automated detection of this harmful organism. The instrument automatically analyzes and displays results, and prints reports, eliminating the need for manual interpretation. It is used for forestry quarantine and infected wood screening....
Online ORP Meter is an instrument capable of real-time online monitoring of oxidation-reduction potential (ORP) in water, also known as an online oxidation-reduction potential analyzer. It is widely used in industrial and laboratory fields, allowing for rapid detection of ORP values. It is suitable for on-site testing or continuous real-time monitoring of surface water, tap water, etc. Its main applications include water treatment plants, water supply networks, swimming pools, cooling water systems, and various water treatment projects....
This lightweight, portable weather station is equipped with precision sensors and a smart chip. It is easy to operate and can simultaneously collect multiple meteorological and location data, making it suitable for various fire emergency and outdoor disaster monitoring scenarios....
Digital Weather Station is a highly integrated, low-power, and rapidly deployable high-precision automatic meteorological observation device. It provides real-time monitoring of nine key meteorological elements—including wind speed, wind direction, temperature, humidity, atmospheric pressure,...


 Get a Free Quote
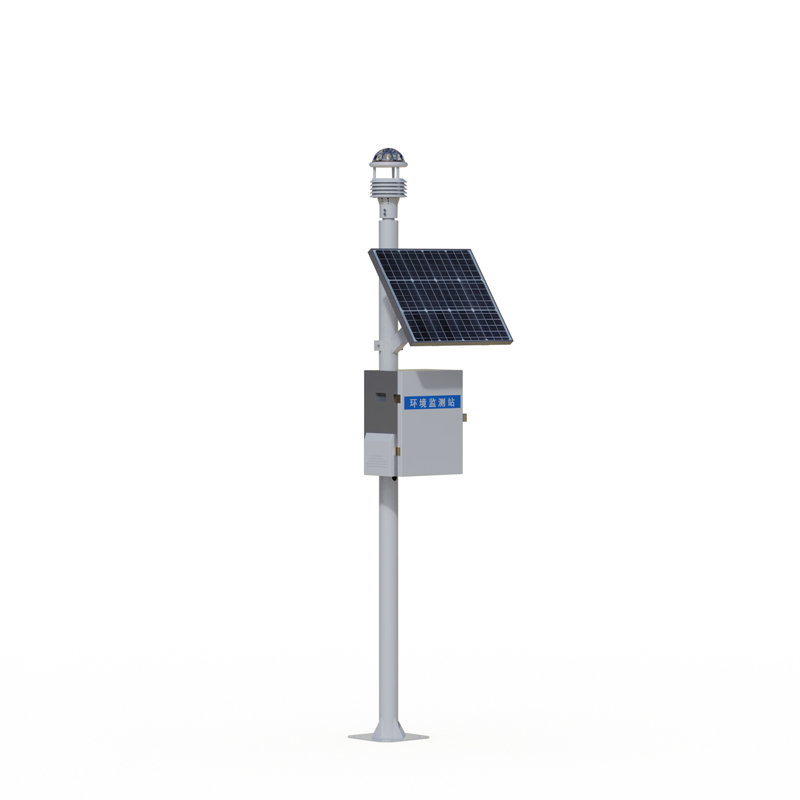
 Skype
Skype
 whatsapp
 mail
mail